Best Time to Sail the British Virgin Islands: Monthly Insights
Month-by-month weather, wind and crowd guidance so you can choose the right week to sail the British Virgin Islands, with hurricane-season planning and booking tips.

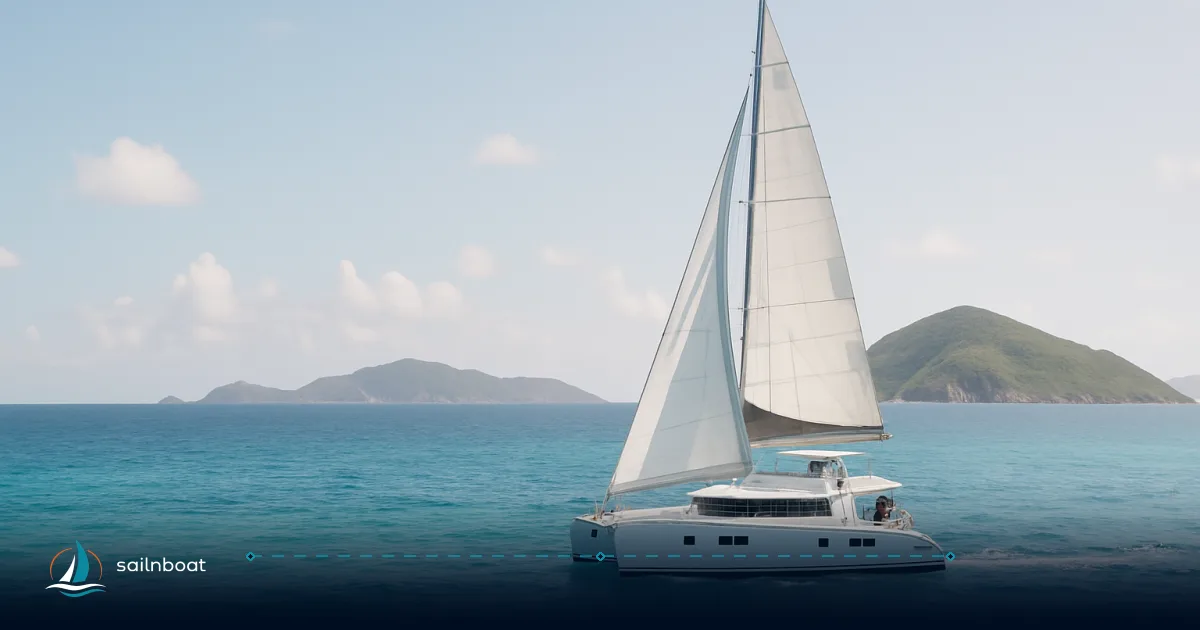
The best sailing window in practical terms is December through April: trades are steadier, rainfall is lower and sea temperatures remain warm, which makes navigation of the Sir Francis Drake Channel and island hops (Tortola → Virgin Gorda → Jost Van Dyke → Anegada) reliably pleasant for a week-long charter. That said, shoulder months (April–June and November) often give the same cruising grounds with fewer people and lower charter prices at modest cost to wind consistency — while June–November is the Atlantic hurricane season and requires active contingency planning.
Monthly Weather Patterns and Wind Conditions
Below I give month groups you’ll most often use when choosing a charter week. Figures are long‑term averages or typical ranges; wind is given in knots and rainfall as long‑term monthly totals converted to an approximate mm/day average so you can compare months quickly.
January to March
- Typical wind: generally easterly trade winds, commonly in the 12–18 kt range with occasional stronger trade surges (gusts to 25–30 kt are possible on short-lived systems). Many charterers find these months the most reliable for reaching and beating around the islands.
- Rainfall: relatively low — Tortola long‑term monthly totals run ~54–68 mm (≈1.8–2.2 mm/day).
- Daily sunshine: typically 8–9 hours on average.
April to June
- Typical wind: trade winds commonly ease into roughly 10–15 kt; lighter days become more frequent in May–June, and you may see more variable sea breezes in protected anchorages.
- Rainfall: increases through May; monthly totals trend ~88–129 mm for Tortola (≈2.9–4.2 mm/day in May). Expect a few more short tropical showers.
- Daily sunshine: 9–10 hours in April–June on average.
July to September
- Typical wind: averages often sit in the 10–14 kt band, but patterns become less predictable — short calms are possible between breezes and tropical squalls. The most significant operational difference here is the increased chance of unsettled tropical weather.
- Rainfall: the wettest months fall in this window and into October; Tortola long‑term totals run ~85–143 mm/month (≈2.7–4.8 mm/day). Expect more frequent squalls and heavier rain cells.
- Daily sunshine: roughly 8–9 hours, but broken by more frequent cloud and afternoon showers.
October to December
- Typical wind: trades often re‑establish in October–December toward the 12–16 kt range; October and November can be changeable as the season turns.
- Rainfall: October–November are among the wettest months — long‑term totals near 161 mm for some months (≈5.2–5.4 mm/day); December dries back out.
- Daily sunshine: 7–9 hours depending on the month; December tends toward more reliable sun.
(Confidence note: wind averages vary by micro‑location and by year — exposed anchorages and passage planning should rely on short‑range forecasts and your charter base’s local briefing the day before you leave.)
Quick monthly comparison table
This table pulls long‑term averages into one glance (wind = typical long‑term average in knots; rainfall given as approximate mm/day from monthly totals; air/sea temps from climate averages). Use it to compare months when deciding dates.
| Month | Avg wind (kt) | Avg rainfall ≈ mm/day | Avg sunshine hrs/day | Avg air temp (°C) | Avg sea temp (°C) | Crowd / Price |
|---|---|---|---|---|---|---|
| Jan | 12–16 | 2.2 | 8 | 29 / 24 (high/low) | 26 | High demand; holiday weeks busy. |
| Feb | 12–16 | 1.9 | 8 | 29 / 24 | 26 | High; popular for regatta season buildup. |
| Mar | 12–17 | 1.8 | 9 | 29 / 24 | 26 | Very busy (Spring Regatta in late March). |
| Apr | 11–15 | 2.9 | 9 | 30 / 25 | 27 | Shoulder — good balance of weather/availability. |
| May | 11–14 | 4.2 | 8–9 | 30 / 26 | 27 | Lower prices start; more rain days. |
| Jun | 12–14 | 2.4 | 8–9 | 31 / 27 | 28 | Shoulder into hurricane season; quieter, good availability. |
| Jul | 13–15 | 2.7 | 9 | 32 / 27 | 28 | Low demand; hotter and more humid. |
| Aug | 12–15 | 4.0 | 9 | 32 / 27 | 29 | Lowest demand, warmest seas, elevated storm risk. |
| Sep | 11–14 | 4.8 | 8 | 32 / 27 | 29 | Peak hurricane statistical risk; cheapest rates but greater risk. |
| Oct | 10–14 | 5.2 | 8 | 31 / 27 | 29 | Weather variable; end of peak season for storms. |
| Nov | 11–13 | 5.4 | 7–8 | 30 / 26 | 28 | Shoulder month; improving conditions late month. |
| Dec | 12–15 | 3.8 | 7–8 | 29 / 25 | 27 | Demand rises for holidays; trades re‑establish. |
Sources for table values: long‑term climate composites and local weather services (Tortola / Road Town averages, sea‑temperature climatologies and trade‑wind data). See above source notes for the station and composite data.
Crowd Levels and Pricing Variations
Peak Season (December to April)
- What you get: the most reliable trades, minimal rain, full marina and charter base services, and major events (BVI Spring Regatta typically in late March). Expect most marinas and moorings to be busiest and many popular anchorages to have limited free space at happy hour.
- Prices: published operator pricing shows clear splits between low and high season — many fleet pages list high‑season starting prices that are substantially above low‑season starts (examples from major operators show high‑season published starts several thousand USD higher than low‑season equivalents). Book 6–12 months ahead for a specific model and week.
Shoulder Season (May to June, November)
- What you get: fewer boats in popular anchorages, better berth/marina availability, and more room to choose less‑trendy bays at prime times of day; prices are commonly lower than peak season. Wind is generally reasonable though a little less predictable than core winter. Many operators run promotions in these months.
Off‑Peak / Hurricane‑season months (July to October)
- What you get: the lowest demand and often the best charter pricing, but with the trade‑off of more showers, occasional calms and a non‑negligible hurricane/tropical‑storm risk — operators may require stricter cancellation and storm‑plan terms. If you choose these months you should accept an elevated chance of itinerary disruption.
Operational note: budget the base charter rate plus an allowance for extras — provisioning, fuel, end‑cleaning and a provisioning/APA budget. A practical planning rule many brokers use is to expect extras to add a substantial portion of the base fee; check operator pages, which commonly show APA/estimates or “budget X–Y%” guidance. Moorings and independent charter guides are good references for current published ranges.
Hurricane Season Considerations
Hurricane Season Timing
- Official window: June 1–November 30 for the Atlantic basin; statistical peak activity centres around early‑ to mid‑September (around September 10) with most activity from mid‑August to mid‑October. That is the climatology used by emergency planners and national meteorological services.
Sailing Preparations and Risk‑management
- Book flexible: pick charters with clear, favourable cancellation & rescheduling rules for named‑storm threats and buy trip insurance that explicitly covers named storms and evacuation expenses if you’re travelling in June–November. Many insurers and charter operators treat named storms and their impacts separately from regular delays.
- Have a hurricane plan: discuss with your charter operator/crew what their standard storm plan is (safe marinas, haul‑out options, secure moorings, evacuation routes). Many charter companies require you follow base instructions for storm planning; know where secure berths are on Tortola (e.g., Beef Island/road Town marinas) and the operator’s policy on moving a boat ashore if necessary.
- Monitor forecasts: use National Hurricane Center products and local meteorological services for watches and warnings; update your plan daily if you charter during the season.
Practical trade‑off: August–October delivers lowest prices and warmest seas but the clearest operational downside is an elevated chance of itinerary cancellation or enforced early returns; if you must sail in that window, accept tighter flexibility and buy suitable insurance.
Temperature Trends: Air and Water
Air Temperature
- Typical pattern: daily highs in winter ~28–30 °C and in summer ~31–32 °C; overnight lows generally mid‑20s °C. The variation month‑to‑month is modest; humidity rises in the summer months. These averages are reflected in Tortola climate tables.
Water Temperature
- Expect very comfortable sea water year‑round: long‑term monthly averages are generally reported as around 26 °C in the coolest months (Jan–Mar) and about 28–29 °C in late summer and early autumn (Aug–Oct), though specific BVI sea temperature data may vary. Warm water reduces need for thick wetsuits — shorties are sufficient for most sail‑snorkel trips.
Advantages and Disadvantages of Peak vs. Shoulder Season
Peak Season Benefits
- Steadiest trades and more predictable sailing days, all charter support services available, events (BVI Spring Regatta) and full marina support; best choice if you prioritise consistent passage making and full service.
Shoulder Season Benefits
- Fewer crowds at popular anchorages, better marina/berth availability, and often meaningful savings on the base charter rates; still generally pleasant weather for cruising.
Drawbacks of Each Season
- Peak: higher prices, crowded moorings, and reduced last‑minute availability.
- Shoulder/Off‑peak: more variable winds, more short heavy showers, and during June–November a real hurricane/tropical‑storm season to plan for.
Booking and Practical Planning Tips (quick checklist)
- Book early for Dec–Apr (6–12 months ahead) and for the Spring Regatta week.
- Ask your operator for their storm policy before you pay: cancellation windows, transferability of dates, credit vs refund.
- Budget for extras: check whether BVI National Park mooring permits are included (operators sometimes include them) — published operator pages cite permit fees commonly in the low tens of USD per week per boat when charged separately. Also budget for provisioning, fuel and APA‑type allowances.
- If you sail July–October, buy trip insurance that explicitly covers named storms and evacuation; have a flexible return‑to‑base plan.
Plan your sailing trip to the British Virgin Islands around these trade‑offs: if you want the most predictable sailing, aim for December–April; if you prize space and savings but accept more variable conditions, choose a shoulder month; and if you go in hurricane season, treat flexibility, insurance and an operator’s storm plan as part of the cost of doing business.
When you’re ready, match the month that fits your priorities (wind consistency vs. price vs. crowd size) and ask your charter operator these exact questions about cancellation, mooring permits and their hurricane plan before you confirm a deposit.
Frequently Asked Questions
The BVI sit in the northeast trade-wind belt; winds most commonly blow ENE–E. Monthly averages typically sit in the ~10–16 kt band (winter months trend higher; late summer can see lighter winds and erratic patterns).
Rain is lowest in winter (Dec–Mar) and highest late summer/early autumn; long‑term monthly rainfall totals for Tortola average roughly 50–160 mm, which works out to about 1.8–5.4 mm/day depending on the month.
Atlantic hurricane season runs June 1–November 30 with statistical peak in September; storms are uncommon outside those dates but not impossible, so plan insurance, flexible bookings and a clear hurricane‑plan with your charter operator.
Air temperatures typically run mid‑ to high‑20s °C in winter and around 30–32 °C in summer; sea temperatures are very pleasant year‑round, roughly 26–29 °C (warmest August–October).
Crowds and charter pricing peak December–April (holiday weeks and Spring Regatta in late March), shoulder months (April–June, November) are quieter and cheaper, while July–October is lowest demand but carries more weather risk.
Peak (Dec–Apr): steadier trades, drier weather, full services — but higher prices and crowded moorings; Shoulder (Apr–Jun, Nov): fewer crowds and better availability, lower rates, but more variable wind and increased chance of rain or tropical disturbances.
Written by
Sailnboat Editorial
The Sailnboat editorial desk covers yacht and boat chartering worldwide — routes, bases, seasons, boat types, paperwork and the practical costs that decide a trip. We are a charter marketplace, not a boat owner or a local agency: what we sell is judgement and support, so our guides are written to help you make a decision, not to sell you a specific boat. Every guide is checked against live operator and marina data before it goes out.
Fact-checked against live operator and marina data, and published under our editorial standards. Last reviewed: .