Sailing Routes Map: Your Guide to Passage Planning
A sailing routes map shows common tracks, hazards, currents and anchoring options; use it to measure legs, estimate daily miles and pick safe overnight stops for your passage plan.

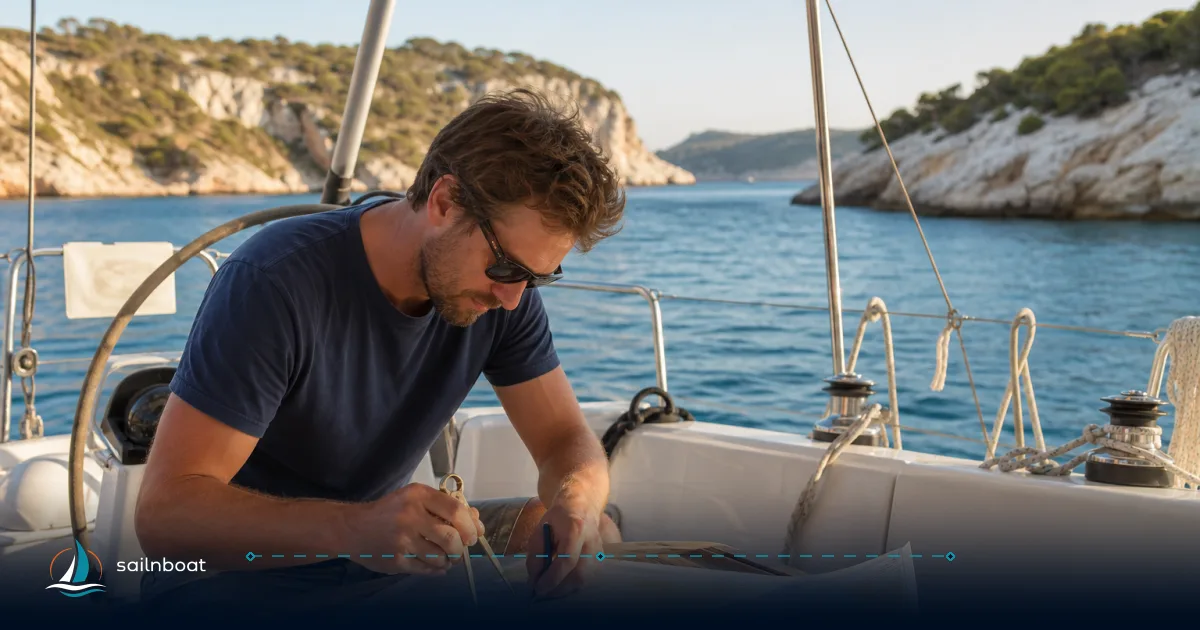
A sailing routes map is a practical tool: it shows common tracks, traffic lanes, hazards and—when combined with tide and weather data—becomes the backbone of a passage plan. Use a sailing routes map to identify where you can safely run a leg, how long it will take at a realistic cruising speed, and which anchorages or marinas make sensible day‑end options; turn it into a day‑by‑day itinerary by measuring NM between waypoints, choosing a cruising speed range and vetting overnight stops before you leave the dock.
Types of Nautical Route Maps
Knowing which map you have determines how you use it. Below are the four types you will encounter and practical strengths and limits.
Historical Shipping Routes
- What they are: long-established lanes and recommended tracks drawn for commercial traffic and deep-draught vessels; many are established or recognised by the IMO. These appear on official charts as traffic separation schemes and recommended tracks.
- Best use: planning to avoid large-ship lanes, understanding where deep water exists and where local commercial traffic will concentrate.
- Caution: historical or IMO-adopted lanes are designed for merchant traffic and larger draughts — they may not be the safest or shortest line for a small cruiser. Treat them as traffic-awareness guidance, not as a recreational route.
Crowd‑Sourced GPX Tracks
- What they are: GPS-recorded tracks and waypoints shared by other sailors via apps, community sites or exported GPX files. Commonly exported and imported between chart apps and plotters.
- Strengths: show real-world choices — where other yachts actually anchor, practical approaches into tricky harbours, or routes that avoid shoals in local conditions.
- Limits: quality varies — tracks can be old, recorded in different tide states, or taken by boats with different drafts. Always cross-check a crowd-sourced GPX against current charts and tide data before following it.
Chart Overlays (Electronic Chart Layers)
- What they are: overlays placed on top of official ENC/ raster charts in chartplotters or desktop software; these include AIS density layers, satellite imagery, GPX traces, bathymetry enhancements, and user notes. Open-source and commercial programs allow persistent overlay layers for tracks and hazards.
- Best use: visualising multiple information types together — for example, your planned line, other users’ tracks, and satellite imagery to check coastline detail.
- Caution: overlays can obscure official chart symbols or give a false sense of precision; keep the official chart layer visible.
Commercial Routing and Passage‑Planning Services
- What they are: paid routing engines and services (weather‑aware routing, current-aware passage planning) that combine GRIB/ensemble weather data with tidal and current models to produce “optimal” routes.
- Strengths: give time/arrival estimates that account for wind and current; useful for longer offshore legs or optimized passages.
- Limits: they depend on the quality of underlying models and require subscriptions for detailed current/tide services. Treat them as decision support, not a replacement for local knowledge or prudent seamanship. PredictWind is a commonly used service offering tidal/current products and routing tools.
Table — at-a-glance comparison
| Map type | Best for | Reliability | When to cross‑check |
|---|---|---|---|
| Historical shipping routes (IMO/TSS) | Avoiding heavy traffic, deepwater routes | High for large-ship traffic; not tailored to yachts | Always — for small-boat tactical choices |
| Crowd-sourced GPX tracks | Practical harbour approaches, anchoring choices | Variable; depends on contributor | With current charts and tide data |
| Chart overlays | Layered situational awareness (AIS, satellite) | High if official charts used underneath | If overlay source is non-official |
| Commercial routing services | Weather/current-optimised passages | High for modelled forecasts; subscription-based | Local pilot info and up-to-date charts |
Interpreting Nautical Route Maps
A route line means nothing until you interpret the chart context: depths, hazards, traffic and the likely effect of tide and current.
Identifying Hazards
- Read the chart: use soundings (depths), contours, isolated dangers and wreck symbols — always referenced to the chart’s datum. If a track hugs a 2–3 m contour and you have a 2 m draft plus tide variation, that line is not safe at low water.
- Look for special symbols: areas to be avoided, submarine cables, restricted areas and wrecks are marked; traffic separation schemes and pilot boarding points are shown on official charts. When in doubt, give such features a healthy margin.
- Cross‑reference sources: if a crowd-sourced track runs close to an area marked “obstruction” on the chart, treat it as suspect and plan a wider clearance.
Understanding Currents
- Why currents matter: currents change your boat’s speed over ground and steerage; a 2‑knot tidal stream adds or subtracts 2 knots to your progress depending on direction.
- How to get current data: use official tide/current services where available (NOAA in the U.S.), or commercial providers that blend tidal and ocean models. For U.S. and some international waters NOAA provides tide/current predictions and modelled nowcasts.
- Practical interpretation: compare the timing of slack water with your intended crossing. If you must cross a strong stream, aim for the period closest to slack to minimise set and risk.
Typical Sailing Lanes and Busy Channels
- Treat traffic lanes seriously: Traffic separation schemes concentrate ship movements; small yachts crossing these lanes should minimise time spent in the lane and follow the COLREGs basics where applicable. The IMO and national authorities publish TSS and recommended tracks on charts.
- Use AIS and lookouts: overlay AIS density or live AIS where possible when planning to transit or cross a busy lane; schedule your crossing for better visibility and favourable traffic patterns.
Creating a Detailed Itinerary from Your Route Map
Turn a map into a usable, watch-sensible plan with measured legs, realistic speed assumptions and vetted overnight options.
Estimating Nautical Miles
- Measure precisely: use your chartplotter’s distance tool or import the GPX route into OpenCPN / your chart app and read the total leg distance from the route manager. Modern apps accept GPX and provide leg totals.
- Use a great‑circle/haversine calculator for ocean legs: the haversine or great‑circle formulas give true shortest distances; many online nautical calculators will return NM directly.
- Add tactical allowances: add NM for required detours (safety margins around shoals, inshore routing to avoid current, or to pass a traffic lane at a safe angle). A sensible allowance is often 3–10% extra NM depending on route complexity.
Practical speed and time math
- Use a realistic average boat speed (through‑water) for planning: typical cruising averages for production cruising monohulls run in the mid single digits (commonly ~6–8 knots) and cruising catamarans often average somewhat higher (commonly ~8–12 knots) depending on design and conditions. These are typical ranges used for planning.
- Example: if a leg is 60 NM and you plan 6–8 knots average, expect underway time of roughly 7.5–10 hours (60 ÷ 8 = 7.5 hrs; 60 ÷ 6 = 10 hrs). Add time for manoeuvres, tides and a safety margin.
Safe Overnight Stops
Criteria checklist (use this every time you accept an anchorage or marina):
- Depth at lowest tide versus your maximum draft and a margin for squat or uncharted shoals.
- Holding ground (sand/mud preferred over weed/rock) and how other yachts report it.
- Swing room: the radius you need equals rode length at high tide; plan for other boats and the tide range.
- Protection from predominant and forecast wind direction for the window you intend to stay.
- Services you need (fuel, water, groceries, customs if crossing borders).
- Local regulations: anchoring bans, marine protected areas or seasonal restrictions.
- Night‑time access and lighting: is the approach lit? Are fairways used at night by ferries or fishing boats?
Anchoring specifics you can plan numerically
- Scope: for overnight anchoring most guidance recommends a scope of roughly 5:1–7:1 (rode:length to depth) depending on conditions; use more scope for poor holding or heavy forecast winds. This is a widely used operational standard.
- Swing radius example: in 6 m of water with 5:1 scope you will lay out roughly 30 m of rode; convert that to a swing radius (plus boat length) when checking room against neighbouring boats and shore.
Day‑by‑Day Breakdown (stepwise)
- Pick daily distance target: base on crew endurance and local conditions — e.g., comfortable cruising for many crews is 40–80 NM per day depending on boat and wind; longer days are possible but have trade-offs. Calibrate to your crew and boat.
- Break the route into legs that match that daily target, then measure exact NM for each leg using your chart tool.
- For each day list:
- Waypoint sequence (lat/long)
- Distance in NM and estimated hours at your planning speed (provide a lower/upper range)
- Primary overnight option (anchorage or marina) with reasons (depth, holding, shelter)
- Alternate stop(s) and the minimum fuel reserve / emergency plan
- Build days for weather: include one or two ‘contingency’ days in your schedule to absorb bad weather or delays; for crossings, plan departure windows around favourable wind/current where possible.
Example day card (short)
- Day 3: WP A → WP B — 58 NM — est. 7–9 hrs at 7–8 kt; berth: small marina (8 m depth at low tide) or anchorage in bay X (sand, good holding); contingencies: harbour Y (30 NM) if headwinds exceed 25 kt.
Practical Tips for Passage Planning
Using Technology
- Combine layers: use chart overlays, a GPX track layer and AIS density or live AIS to get simultaneous situational awareness. OpenCPN, common commercial plotters and apps support GPX import and overlay layers.
- Tides and currents: use official tide/current services where they exist (NOAA for U.S. waters) and supplement with commercial current models for oceanic areas; commercial services may offer tidal‑current layers useful for timing departures.
- Keep offline copies: download charts, the GPX route and weather GRIB files you expect to need if you might be out of connectivity.
- Use route-export consistently: export your planned route as GPX and keep a copy on a backup device and on paper (lat/lon list and bearings) so you have redundancy. Many chart apps and plotters allow GPX import/export between devices.
Consulting Local Resources
- Talk to the marina/harbourmaster before arrival: they will confirm depth at their berth, availability and any local notices or restrictions.
- Check recent pilotage notes and cruising guides: these often report up‑to‑date anchorage holding reports and preferred approaches that aren’t obvious on charts.
- Use community reports sensibly: crowd-sourced anchor reports and track logs give real-life context, but always corroborate against the official chart and current tide state — a track recorded at high water may be unsafe at low water.
Final operational checklist before cast-off
- One-line route summary with daily NM totals and planned arrival times.
- Tide/current windows for each leg where set is significant.
- Confirmed overnight options with contact numbers or marina booking where required.
- Weather brief and at least one contingency day.
- Copies of GPX route on at least two devices (plotter/tablet/phone) and paper backup.
You now have the framework to read any sailing routes map and turn it into a practical, safe passage plan: know the map type, interrogate charts for hazards and traffic, measure NM precisely, choose realistic speeds and vet overnight stops with depth, holding and swing room in mind. Use layered tech intelligently and keep local, up‑to‑date information in the loop — that is what converts a good route map into a reliable passage.
Start planning your next passage by exporting a GPX trace from your chart app, overlaying it on a current chart, and running a distance check — use the steps here to build the first day card and book the first night’s berth or anchorage.
Frequently Asked Questions
There are historical shipping routes and official routeing (IMO traffic lanes), crowd-sourced GPX tracks from cruising communities and apps, and chart-based overlays produced by commercial chartplotters and software; each has a different purpose and reliability level.
Read chart symbols and depths, cross-reference route lines with traffic separation schemes and known hazards (rocks, wrecks, cables), and consult tide/current services or GRIB-based current models to see likely set on each leg.
Break the route into sensible waypoints, measure NM between them with your chartplotter or a great‑circle tool, decide a realistic average speed for the boat and conditions, then split into daily legs with vetted overnight options and contingency days for weather.
Use the chartplotter/ADF tool or a great‑circle (haversine) calculator to get precise NM between waypoints; add distance allowances for required detours around hazards or to meet tide windows.
Consider depth at lowest tide, holding ground, swing room (including recommended anchor scope), shelter from forecast wind, proximity to services, local regulations and traffic; where uncertain, prefer marinas or protected anchorages with good holding.
Written by
Sailnboat Editorial
The Sailnboat editorial desk covers yacht and boat chartering worldwide — routes, bases, seasons, boat types, paperwork and the practical costs that decide a trip. We are a charter marketplace, not a boat owner or a local agency: what we sell is judgement and support, so our guides are written to help you make a decision, not to sell you a specific boat. Every guide is checked against live operator and marina data before it goes out.
Fact-checked against live operator and marina data, and published under our editorial standards. Last reviewed: .